
Tracking review request performance metrics is crucial for understanding and improving the request process within the multi-location section of Business App.
Accessing Request Performance Metrics
To access Request Performance metrics for multi-location businesses:
- From your main Account List, navigate to the “Requests” menu item located in the Navigation Bar
![]()
- Select “Performance” from the submenu
![]()
Understanding the Metrics
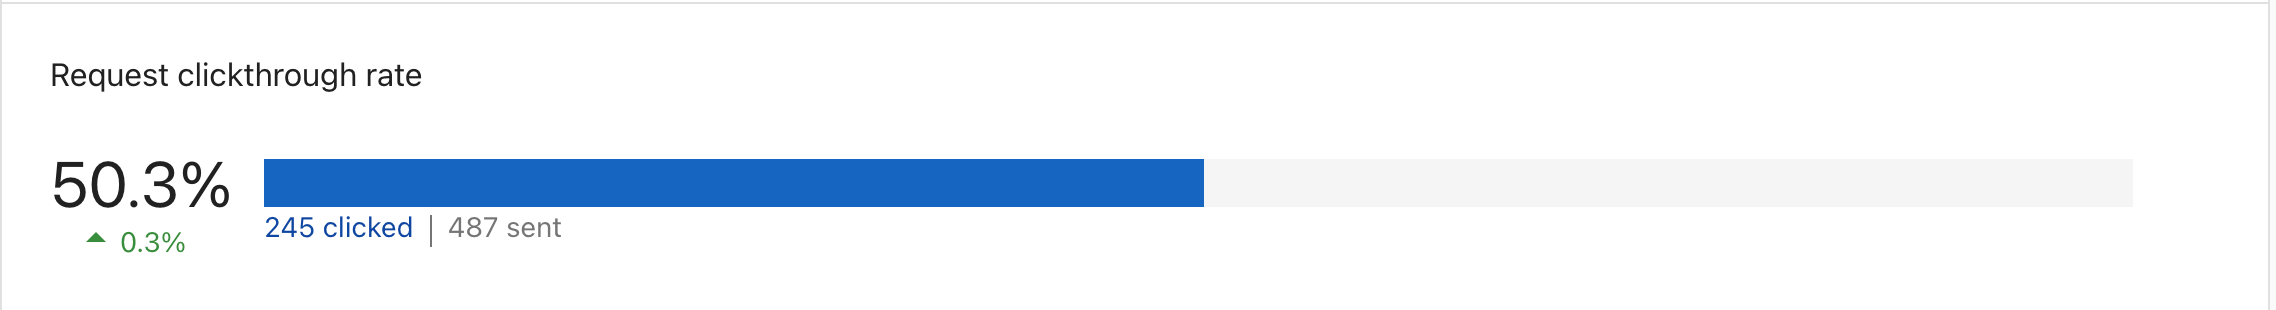
The Performance page displays an overview of request performance metrics for all locations within the business:
Key Metrics Explained
- Requests Sent: The total number of review requests sent
- Email Open Rate: The percentage of sent emails that were opened
- Feedback Rate: The percentage of requests that resulted in feedback (either from the review site or from your feedback form)
- Reviews Collected: The number of reviews collected as a result of your requests
Viewing Metrics by Location
Below the overview, you can see metrics broken down by individual locations:
![]()
This view allows you to compare performance across different locations and identify which locations may need additional attention or support.
Filtering Options
The filter options in the top right corner allow you to customize the date range and filter by specific locations:
![]()
You can:
- Set a specific date range for the data
- Filter by location name
- Sort the data by various metrics
Using These Metrics
These metrics can help you:
- Identify which locations are most effective at generating reviews
- Spot trends in review request performance over time
- Compare the performance of different locations to identify best practices
- Identify locations that may need additional training or support with their review request process
Best Practices
- Regular Monitoring: Check these metrics regularly to track progress and identify issues early
- Compare Locations: Use the location breakdown to identify top performers and share their strategies with other locations
- Test Different Approaches: Try different request methods or messaging and track the impact on your metrics
- Set Goals: Establish performance targets for each location based on these metrics